Students Tutorial Answers Week7
There is document - Students Tutorial Answers Week7 available here for reading and downloading. Use the download button below or simple online reader.
The file extension - PDF and ranks to the School Work category.

304
views
Tags
Related
Comments
Log in to leave a message!
Description
Download Students Tutorial Answers Week7
Transcripts
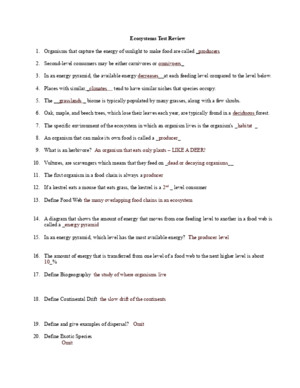
BES Tutorial Sample Solutions, S2 2010 It will be posted on BES website with one week delay WEEK 7 TUTORIAL EXERCISES (To be discussed in the week starting August 30) 1 From several years’ records, a fish market manager has determined that the weight of deep sea bream sold in the market ( X ) is approximately normally distributed with a mean of 420 grams and a standard deviation of 80 grams Assuming this distribution will remain unchanged in the future, calculate the expected proportions of deep sea bream sold over the next year weighing (a) between 300 and 400 grams 300 400 30042080 40042080 15 025 0 150 025 0433200987 03345 (b) between 300 and 500 grams 300 500 30042080 50042080 15 1 0 150 1 0433203413 07745 (c) more than 600 grams 600 600 42080 225 050 225 0504878 00122 2 In a certain large city, household annual incomes are considered approximately normally distributed with a mean of 40,000 and a standard deviation of 6,000 What proportion of households in the city have an annual income over 30,000? If a random sample of 60 households were selected, how many of these households would we expect to have annual incomes between 35,000 and 45,000? ~40000,6000 ) 30000 30000 400006000 167 05 0 167 05 04525 09525 So 9525% of households in the city have annual incomes greater than 30,000 35000 45000 35000400006000 45000 400006000 083 083 20 083 202967 05934 Therefore we expect 05934(60) ≈ 36 households in the sample to have annual incomes between 35,000 and 45,000 3 In a certain city it is estimated that 40% of households have access to the internet A company wishing to sell services to internet users randomly chooses 150 households in the city and sends them advertising material For the households contacted: (a) Calculate the probability that less than 60 households have internet access? Let X be the number of households contacted that have internet access Then assume X is a binomial random variable with n=150 and p=04 Because n is large we can use the normal approximation to the binomial where: 15004 60 1 1500406 36 Thus incorporating the continuity correction we need to find: 60 59 595 595606 0083 050 0083 0500319 04681 (b) Calculate the probability that between 50 and 100 (inclusive) households have internet access? 50 100 495 1005 495606 1005606 175 675 0 1750 675 0459905 09599 (c) Calculate the probability that more than 50 households have internet access? 51 505 505 606 1583 05 04429 09429
Recommended