Piata Transporturilor de Marfa Romania 2008-2014 - Prezentare Rezumativa
There is document - Piata Transporturilor de Marfa Romania 2008-2014 - Prezentare Rezumativa available here for reading and downloading. Use the download button below or simple online reader.
The file extension - PDF and ranks to the Documents category.
Tags
Related
Comments
Log in to leave a message!
Description
Download Piata Transporturilor de Marfa Romania 2008-2014 - Prezentare Rezumativa
Transcripts
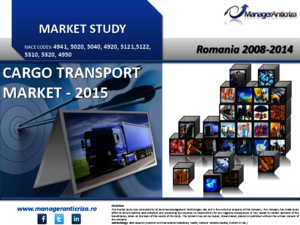
Romania 2008-2014 CARGO TRANSPORT MARKET - 2015 MARKET STUDY NACE CODES: 4941, 5020, 5040, 4920, 5121,5122, 5310, 5320, 4950 wwwmanageranticrizaro Disclaimer The market study was conducted by SC Business Management Technologies SRL and is the exclusive property of the company The company has made every effort to ensure optimal data collection and processing but assumes no responsibility for any negative consequence or loss caused by certain decisions of the beneficiaries, taken on the basis of the results of this study The content may not be copied, disseminated, altered or published without the written consent of the company Methodology : desk research (national and international databases, media, national statistics bodies, EUROSTAT etc) CONTACT: vanzarimanageranticrizaro; Phone no: 0723 627 200 GENERAL DATA TABLE OF CONTENTS EXECUTIVE SUMMARY 3 I INTERNATIONAL FREIGHT TRANSPORT MARKET 5 11 Global freight transport market 2010-2020 6 12 Analysis of regional indicators 2009-2014 7 II ROMANIAN FREIGHT TRANSPORT MARKET 8 21 Highlights of domestic macroeconomic context 2008-2017 9 22 Freight transport market general issues 2008-2014 10 23 Road freight transport market 2008-2014 11 24 Competitive environment road freight transport – financial indicators 14 25 Road freight transport - main competitors ’ presentation 19 26 Rail freight transport market 2008-2014 28 27 Competitive environment rail freight transport – financial indicators 30 28 Rail freight transport – main competitors ’ presentation 34 29 Waterways freight transport market 2008-2014 39 210 Competitive environment on waterways transport – financial indicators 41 211 Waterways freight transport – main competitors ’ presentation 42 212 Air freight transport market 2008-2014 45 213 Air freight transport market – main competitors ’ presentation 46 III MARKET ANALYSIS ON NACE CODES 44 IV MANAGEMENT CONSULTING ANALYSIS 54 41 Value chain analysis 55 42 Porter analysis 56 43 PEST analysis 57 44 Factors of influence 58 45 Managerial recommendations 59 Format: PDF No of pages: 62 No of charts: 93 No of tables: 41 Period in scope: 2008-2014 No of companies analyzed: 25 No of company profiles: 18 Methodology: desk research (national and international databases, companies operating in the sector, national statistics bodies) THE REPORT IN NUMBERS CONTACT: vanzarimanageranticrizaro; Phone no: 0723 627 200 REPORT STRUCTURE General statistical data regarding the market development worldwide Comparison of the local market with similar markets in SE Europe Domestic macroeconomic factors that influence the target market Local market development Presentation of the main market segments Forecasts of the subject market MARKET DYNAMIC CHARTS Macroeconomic indicators Market value in Romania Romanian market structure Market segments’ dynamic Market shares of the main players CHARTS ( selection ) A Top 10 market players presentation ( 2014 turnover criterion ) Turnover/employee Net profit/employee dynamic for each of the Top 10 companies analyzed (2008-2014) Company profile for the Top 10 market players ( company background, non-financial data presentation, key financial ratios dynamic) Financial indicators calculated and interpreted for 2008-2014 for each of the Top 10 companies (turnover, net profit, total debt/total assets, total number of companies, number of employees, net profit margin ) COMPETITIVE LANDSCAPE CHARTS The weight of each company in the cumulated turnover of the Top 10 players Net profit margin of the Top 10 players Turnover Net profit / employee change TABLES Turnover dynamic (2008-2014) Turnover / employee change Net profit / employee cahnge Key financial data 2008-2014 CHARTS TABLES ( selection ) B For a deeper market research, an analysis on NACE codes was made, based on the total values at national level (total companies that have registered the activity as core business) It is a thorough review where financial indicators such as turnover, net profit, total debt/total assets, total number of companies, number of companies with losses / profits, number of employees, net profit margin are calculated and interpreted for 2008-2014The companies were structured in 13 groups by turnover criterion MARKET ATTRACTIVENESS ON NACE CODES C These sections includes management consulting analyzes useful in determining the attractiveness of the studied market In the Value Chain Analysis each segment of the value chain is presented, with players name and segment average profitability, providing the overall image of the entire economic flow In the PORTER Analysis are presented the most important factors that influence the market along with an assesment of their strength PEST Analysis presents the main factors that influence the decisions, strategies and objectives of companies operating in this sector GENERAL MARKET ASSESMENT D
Recommended







![[wwwfisierulmeuro] Romania - Harta rutierapdf](imgdoc/100390.jpg)