DI 03 BLR byjus
There is document - DI 03 BLR byjus available here for reading and downloading. Use the download button below or simple online reader.
The file extension - PDF and ranks to the Presentations category.

262
views
Tags
Related
Comments
Log in to leave a message!
Description
Download DI 03 BLR byjus
Transcripts
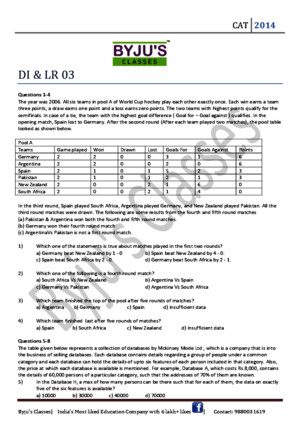
CAT 2014 Byju’s Classes| India’s Mos t liked Education Company with 6 lakh+ likes| Contact: 9880031619 DI LR 03 Questions 1-4 The year was 2006 All six teams in pool A of World Cup hockey play each other exactly once Each win earns a team three points, a draw earns one point and a loss earns zero points The two teams with highest points qualify for the semifinals In case of a tie, the team with the highest goal difference ( Goal for – Goal against ) qualifies In the opening match, Spain lost to Germany After the second round (After each team played two matches), the pool table looked as shown below Pool A Teams Game played Won Drawn Lost Goals For Goals Against Points Germany 2 2 0 0 3 1 6 Argentina 2 2 0 0 2 0 6 Spain 2 1 0 1 5 2 3 Pakistan 2 1 0 1 2 1 3 New Zealand 2 0 0 2 1 6 0 South Africa 2 0 0 2 1 4 0 In the third round, Spain played South Africa, Argentina played Germany, and New Zealand played Pakistan All the third round matches were drawn The following are some results from the fourth and fifth round matches (a) Pakistan Argentina won both the fourth and fifth round matches (b) Germany won their fourth round match (c) ArgentinaVs Pakistan is not a first round match 1) Which one of the statements is true about matches played in the first two rounds? a) Germany beat New Zealand by 1 - 0 b) Spain beat New Zealand by 4 - 0 c) Spain beat South Africa by 2 - 0 d) Germany beat South Africa by 2 - 1 2) Which one of the following is a fourth round match? a) South Africa Vs New Zealand b) Argentina Vs Spain c) Germany Vs Pakistan d) Argentina Vs South Africa 3) Which team finished the top of the pool after five rounds of matches? a) Argentina b) Germany c) Spain d) Insufficient data 4) Which team finished last after five rounds of matches? a) Spain b) South Africa c) New Zealand d) Insufficient data Questions 5-8 The table given below represents a collection of databases by Mckinsey Mode Ltd ; which is a company that is into the business of selling databases Each database contains details regarding a group of people under a common category and each database can hold the details of upto six features of each person included in that category Also, the price at which each database is available is mentioned For example, Database A, which costs Rs8,000, contains the details of 60,000 persons of a particular category, such that the addresses of 70% of them are known 5) In the Database H, a max of how many persons can be there such that for each of them, the data on exactly five of the six features is available? a) 10000 b) 30000 c) 40000 d) 70000 CAT 2014 Byju’s Classes| India’s Mos t liked Education Company with 6 lakh+ likes| Contact: 9880031619 6) In Database E, the number of persons, each of whose name, fax number as well as telephone number are available, is at least a)1500 b) 3000 c) 4500 d)7500 7) In Database J, it was found that there were a few persons for whom the data on no other detail except name was available In such cases, it will cost Mckinsey Mode at most Rs 6 per person for further investigation, then what is the maximum possible amount that may be required to be spent to investigate all such cases? a) Rs 3lakh b) Rs 6lakh c) Rs 9lakh d) Rs 54 lakh 8) In which of the given databases is the number of persons for each of whom the data on their E-mail is available the least? a) B b) M c) F d) None of these Database Details in percentage No of entries Price (Rs) Name Age Address Mob no Fax no E mail A 100 80 70 85 55 90 60,000 8,000 B 100 85 95 90 10 100 9000 1500 C 100 45 90 90 20 70 20,000 60,000 D 100 20 85 95 40 80 8,00,000 100,000 E 100 40 80 80 50 80 15,000 1,700 F 100 70 100 75 75 90 5500 6000 G 100 30 50 60 20 80 20,00,000 2,00,000 H 100 30 70 60 10 70 1,00,000 15,000 I 100 70 75 70 5 100 2,00,000 5,000 J 100 80 85 75 10 40 10,00,000 70,000 K 100 80 100 85 1 30 10,00,000 80,000 L 100 10 80 100 5 20 20,00,000 1,00,000 M 100 100 80 75 20 90 11,000 6,000 Directions for questions 9-12 China imports Rs 17609863 mn China exports Rs 14160353 9) If exports to Korea from China forms 80% of the exports to Asia and imports from Korea forms 73% of import from Asia then trade balance of China as defined earlier with Korea is a) 960000 mn deficit b) 450000 mn deficit c) 630000 mn deficit d) Can’t say australia4%others5%africa7%asia40%europe32%USA12% China import 1998-99 australia2% others4%africa4%asia40%europe27%USA23% China export 1998-99 CAT 2014 Byju’s Classes| India’s Mos t liked Education Company with 6 lakh+ likes| Contact: 9880031619 10) If the foreign exchange reserves in the beginning of 1998-99 were Rs11341 bn and Rs2961 bn were withdrawn by Chinese residing abroad, then what will be the reserve at the end of year after adjusting trade deficit of the year? a) 2398 bn b) 9961 bn c) 4930 bn d) data insufficient 11) The total import to China in 1998-1999 from Europe and Africa was nearly balanced by the total export from China to a) Asia, USA, Africa b) Asia, Europe, Africa c) Europe, USA, Africa d)Asia,others,Africa 12) If the import is growing at an annual rate of 15 % and export is growing at an annual rate of 5 % then percentage increase in trade deficit from 1998-1999 to 2002-03 will be nearest to ? a) 290 % b) 340 % c) 210 % d) 150% Questions 13 to 16: The table given below represents the classification of the car industry in India Distribution of car sales of different manufacturers according to the segments SEGMENTS MANUFACTURERS MARUTHI HYUNDAI TATA GM MAHINDRA B 24% 16% 32% 24% 28% B+ 16% 24% 10% 16% 8% C 18% 24% 15% 32% 12% D 36% 20% 35% 24% 48% E 6% 16% 8% 4% 4% TOTAL 100% 100% 100% 100% 100% Distribution of car sales in different segments according to the manufacturers MANUFACTURERS SEGMENTS B B+ C D E MARUTHI 15% 20% 15% 18% 15% HYUNDAI 5% 15% 10% 5% 20% TATA 40% 25% 25% 35% 40% GM 225% 30% 40% 18% 15% MAHINDRA 175% 10% 10% 24% 10% TOTAL 100% 100% 100% 100% 100% 13) The number of cars sold in the D segment is same as the number of cars sold by which of the following manufacturers? a) Maruthi b) Hyundai c) Tata d) GM 14) By what percentage is the the number of cars sold in the B segment more/less than the total number of cars sold by Maruthi? a) 9% b) 375% c) 50% d) 60% 15) What is the ratio of number of cars sold by Hyundai to that of Mahindra? a) 2:3 b) 1:2 c) 3:4 d) 4:9 16) What is the ratio of number of cars sold by GM in the E segment to that of Maruthi in the B segment? a) 1:4 b) 1:3 c) 2:5 d) 5:6
Recommended