A Fractal Forecasting Model for Financial Time Series
There is document - A Fractal Forecasting Model for Financial Time Series available here for reading and downloading. Use the download button below or simple online reader.
The file extension - PDF and ranks to the Documents category.

440
views
Tags
Related
Comments
Log in to leave a message!
Description
Download A Fractal Forecasting Model for Financial Time Series
Transcripts
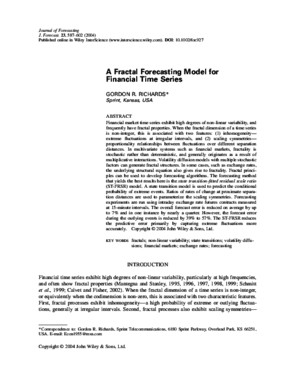
Copyright © 2004 John Wiley & Sons, Ltd A Fractal Forecasting Model for Financial Time Series GORDON R RICHARDS* Sprint, Kansas, USA ABSTRACT Financial market time series exhibit high degrees of non-linear variability, and frequently have fractal properties When the fractal dimension of a time series is non-integer, this is associated with two features: (1) inhomogeneity— extreme fluctuations at irregular intervals, and (2) scaling symmetries— proportionality relationships between fluctuations over different separation distances In multivariate systems such as financial markets, fractality is stochastic rather than deterministic, and generally originates as a result of multiplicative interactions Volatility diffusion models with multiple stochastic factors can generate fractal structures In some cases, such as exchange rates, the underlying structural equation also gives rise to fractality Fractal princi- ples can be used to develop forecasting algorithms The forecasting method that yields the best results here is the state transition-fitted residual scale ratio (ST-FRSR) model A state transition model is used to predict the conditional probability of extreme events Ratios of rates of change at proximate separa- tion distances are used to parameterize the scaling symmetries Forecasting experiments are run using intraday exchange rate futures contracts measured at 15-minute intervals The overall forecast error is reduced on average by up to 7% and in one instance by nearly a quarter However, the forecast error during the outlying events is reduced by 39% to 57% The ST-FRSR reduces the predictive error primarily by capturing extreme fluctuations more accurately Copyright © 2004 John Wiley & Sons, Ltd key words fractals; non-linear variability; state transitions; volatility diffu- sions; financial markets; exchange rates; forecasting INTRODUCTION Financial time series exhibit high degrees of non-linear variability, particularly at high frequencies, and often show fractal properties (Mantegna and Stanley, 1995, 1996, 1997, 1998, 1999; Schmitt et al, 1999; Calvet and Fisher, 2002) When the fractal dimension of a time series is non-integer, or equivalently when the codimension is non-zero, this is associated with two characteristic features First, fractal processes exhibit inhomogeneity—a high probability of extreme or outlying fluctua- tions, generally at irregular intervals Second, fractal processes also exhibit scaling symmetries— Journal of Forecasting J Forecast 23, 587–602 (2004) Published online in Wiley InterScience (wwwintersciencewileycom) DOI: 101002/for927 * Correspondence to: Gordon R Richards, Sprint Telecommunications, 6180 Sprint Parkway, Overland Park, KS 66251, USA E-mail: Econ1955msncom 588 G R Richards Copyright © 2004 John Wiley & Sons, Ltd J Forecast 23, 587–602 (2004) proportionality relationships between fluctuations at different separation distances Evidence of frac- tality in financial markets does not imply chaoticity—behaviour reminiscent of randomness produced by a small number of deterministic equations Prior studies have found no evidence of chaotic attractors (Brock and Sayers, 1988; Hsieh, 1991, 1993) Instead, fractality in large-scale multivari- ate systems such as financial markets is stochastic and high-dimensional This type of fractality generally originates as a result of multiplicative interactions between two or more stochastic processes Much of the recent literature on non-linear variability in financial markets has been based on volatility diffusions with multiple stochastic factors References include Andersen (1994), Andersen and Lund (1997), Andersen and Bollerslev (1997), Andersen et al (1999), Bollerslev and Mikkelsen (1996), Bates (1996), Fouque et al (2000), Gallant et al (1999) Volatility diffusions with multi- plicative relationships between stochastic factors will as a rule generate fractality Let Wit denote i separate Levy motions, let Ujt denote j separate stochastic factors, let s be the diffusion coefficient or positive root of the variance, and let Yt be a time series The following equations describe a multiple factor diffusion in continuous time: (1) (2) (3) where the w, w´, w¯ are fixed coefficients The stochastic factors U2t and U3t evolve according to Ornstein–Uhlenbeck processes The second factor U2t allows for variation in the drift The diffusion coefficient varies as a function of the stochastic factor U3t and the Levy motions dW1t, dW3t Because of the multiplicative relationship between the Levy motion terms in equations (1) and (3), simulations of this type of model invariably give rise to fractal structures, as reported below At longer separation distances, financial series can be modelled using structural equations, which are generally non-fractal In this sense, it is reasonable to characterize economic time series as exhibiting fractal properties at short horizons, but converging to equilibria asymptotically In some instances, however, the underlying structural equations will also generate fractality The clearest case in point is the exchange rate, hypothesized to be determined by differentials in real rates of return Let Xt be the exchange rate, let It be the interest rate, let the superscript e denote expectations, let et be the residual, and let the subscript F denote foreign The structural equation is of the form: (4) As pointed out in Mandelbrot (1997), taking ratios of stochastic processes can give rise to non-linear variability For this reason, the term [(ln It - lnp et) - (ln IFt - lnp eFt)] implies fractal behaviour More- over, nominal and real interest rates can also be shown to be fractal, so that the differential in real rates of return is itself a difference of two independently fractal processes If fractality is found in economic series, the issue arises as to whether it can be exploited in order to forecast The forecasting algorithms analysed here combine two methods One is to predict the conditional probability of extreme events using a state transition model The other is to build a model of the scaling symmetries at short horizons The second section discusses some analytic concepts The third section sets out the forecasting models The fourth section estimates the fractal codimen- sion, order of integration and probability distribution for exchange rates, exchange rate futures con- ln ln ln ln ln lnX X I It t t e Fl Fte l= + + -( ) - -( )[ ] +-w w w p p e0 1 1 2 1 dU U dt U dWt t t t3 30 31 3 30 31 3 3= +( ) + ¢ + ¢( )w w w w dU U dt dWt t21 20 22 2 20 2= +( ) + ¢w w w dY U dt U dW dWt t t t t= +( ) + ¢ + ¢( ) +( )w w s w w w w10 12 2 10 13 3 11 1 13 3 A Fractal Forecasting Model 589 Copyright © 2004 John Wiley & Sons, Ltd J Forecast 23, 587–602 (2004) tracts and interest rates The fifth section conducts forecasting experiments The sixth section dis- cusses the relationship between fractals, ARCH models and volatility diffusions THE FRACTAL DIMENSION AND THE SCALING SYMMETRY There are any number of definitions of dimensionality in the fractal literature; probabilistic meas- ures such as the information and pointwise dimensions are more relevant to stochastic processes (Medio, 1992) The basic idea is that the number of occurrences of a process falling outside a particular threshold or boundary behaves as a power law Let N be the number of events, let L be the characteristic length, and let D be the embedding dimension of the space that encompasses the process; for a time series, D = 1 Let d be the fractal dimension A probabilistic measure of dimen- sionality for the absolute log-difference of Yt is given by: ln[N(|lnYt - lnYt-1|) > L / N(|lnYt - lnYt-1|)] / lnL The share of observations that lie outside the threshold, L, relative to the total sample, varies as a power-law function of the dimension: (5) where ª denotes asymptotic equality In this sense, dimensionality is a measure of entropy or disorder The dimension varies as a function of the threshold, and therefore has often been measured as the asymptotic limit as the threshold approaches zero A more recent idea is to estimate the average inhomogeneity of the process, using the codimension, C, which is the difference between the embed- ding dimension and the fractal dimension: C = D - d For all C π 0, the process is said to be fractal At low degrees of fractality (C close to zero), the process is more homogenous: there are few extreme fluctuations Conversely, for higher values of C, there are more extreme events, or fluctuations outside the threshold The process becomes less homogenous, more intermittent, sparser and more volatile The codimension formalism and the overall mathematical framework used here is that of Schertzer and Lovejoy (1991); see also Schertzer et al (1997); Schmitt et al (1992, 1993); Lavallee et al (1991, 1992) The relationship between the codimension and the scaling symmetry is given by the following equations Let t be a time scale running from 1 to T, where T is the largest horizon of interest Let m denote the mean Let q denote a series of scaling exponents The scaling symmetry is of the form: (6) where z is a function This states that the mean absolute log-difference (raised to the power q) is proportional to the mean absolute log-difference at larger separations in time, when scaled by the term [(t/T )z(q)] The theoretical form of z(q) is universal and incorporates three parameters, denoted C1, H, a: (7) z a a z a aq qH C q q q qH C q q ( ) = - -( )[ ] -( ){ } π ( ) = - ( ) = 1 1 1 1 1 when whenln m m t zln ln ln lnY Y Y Y Tt t q t t T q q-( ) ª -( )[ ] ( )[ ]- - ( )1 N Y Y L N Y Y Lt t t t dln ln ln ln-( ) > -( )[ ] ª- -1 1 590 G R Richards Copyright © 2004 John Wiley & Sons, Ltd J Forecast 23, 587–602 (2004) The parameter C1 is the codimension associated with scaling the sample means When C1 = 0, z(q) is a linear trend When C1 π 0, the curvature of z(q) depends on both the codimension and the probability distribution The coefficient a characterizes the probability distribution The case of a = 2 corresponds to the Gaussian, while a = 1 corresponds to the Cauchy Most economic processes show 1 < a < 2 In this case the distribution has heavier tails than the standard normal, and the vari- ance is time-varying An interesting property of series that exhibit both 1 < a < 2 and 0 < C1 < 1 is that integration generally does not result in a smooth path for the level series Instead, the integral will exhibit discrete jumps The coefficient H characterizes the non-conservation of the mean The notation H actually originates with the Hurst exponent, or rescaled range coefficient, a widely used measure of memory (Hurst, 1951) In this framework, however, H is estimated as one in a series of scaling coefficients This statistic is related to the order of integration by an additive constant For an I(0) process, H = 05 For a non-stationary process, the order of integration can be recovered by estimating H on the rate of change (Beran, 1992) This method is robust both to non-linearity and to fractional orders of integration THE FORECASTING ALGORITHMS Given the dual properties of extreme events and scaling symmetries, it is natural to develop models that can capture both features State transition models have been common in the literature (Gray, 1996; Hamilton, 1989, 1994; Terasvirta, 1994) The state transition is here specified for the transi- tion from a state of low or intermediate variability to an extreme state, and is denoted SEt The state transition model for the exchange rate can be specified as: (8) The state can be predicted iteratively using a regression of the form: (9) where the rate of change as well as the level of the exchange rate is included on the RHS on the grounds that in practical applications this was found to improve the results This type of model does of course have one intrinsic risk: the state transitions may be predicted incorrectly To guard against this possibility, models with and without state transitions should be esti- mated A further issue in implementation is that including state transitions on all of the RHS vari- ables can make the model too complex A limited number of state transitions, on selected causal factors, may be preferable A final problem is how to specify the extreme event This can be deter- mined empirically, by testing the values that yield the best forecasts In the tests below, absolute rates of change two to five times greater than the conditional mean were essayed, and were found to yield good results The idea of using the scaling symmetry in order to forecast was originally proposed in Schertzer et al (1997, pp 456–458) for physical processes that exhibit strong symmetries between large and small scales Since proportionality relationships in economic series are generally limited to shorter intervals, the models here use only the proximate symmetry The following equations were set out S S X X XEt Et t t l l+ -= + + + -( ) +1 0 1 2 3 1w w w w eln ln ln ln ln ln ln ln ln ln ln ln ln ln X X I I S X S I I t t t t e Ft Ft e E t t Et t t e Ft Ft e t + = + + -( ) - -( )[ ] + + -( ) - -( )[ ] + 1 0 1 2 3 4 w w w p p w w p p e A Fractal Forecasting Model 591 Copyright © 2004 John Wiley & Sons, Ltd J Forecast 23, 587–602 (2004) in Richards (2002) For the predicted rate of change, there is a symmetry with respect to the most recent lag: (10) where l1t is the proportionality coefficient, the numerical subscript denotes the separation distance on the RHS, and the t-subscript indicates time-variation Similarly, for the observed rates of change: (11) Solving for l2t: (12) One practical problem in implementation is that the denominators of the ratios may contain zero values Any number of interpolation procedures can be used to impute missing values In the experi- ments below, when the ratio was indeterminate, the data was exponentially smoothed, and the ratio based on the smoothed data was substituted Other imputation methods yielded similar results The forecasting model for the overall process is then: (13) As noted above, most structural equations in macroeconomics do not imply long-term fractality This argues for fitting a structural equation, and constructing the scale ratios for the residual: (14) (15) where g2t is the proportionality coefficient for the residual The forecasting model therefore becomes: (16) where �t is the residual from this regression This is the residual scale ratio (RSR) model The main drawback associated with the SR and RSR models is that the scale ratios are known only for the current period Further, in practical tests, the scale ratios were often found to be too volatile to forecast effectively A reasonable solution is to factor the scale ratio into two components, a systematic process and a residual Let g2St denote the systematic component in g2t Generally, the forecaster does not know the form of this component, but can estimate it using a regression on lags: (17) The predicted value, g2St+1, is then included in the forecasting equation This is the fitted residual scale ratio (FRSR) model: (18)ln ln ln ln ln lnX X I It t t te Ft Fte St t+ += + + -( ) - -( )[ ] + +1 0 1 2 3 2 1w w w p p w g n g w w g w g n2 0 1 2 1 2 2 2St l t t= + + +- - ln ln ln ln ln lnX X I I vt t t te Ft Fte t t+ = + + -( ) - -( )[ ] + +1 0 1 2 3 2w w w p p w g g e e e e2 1 1 2t t t t= -( ) -( )[ ]- - e e g e el t t t t-( ) = -( )- -1 2 2 ln ln ln ln ln lnX X I It t t te Ft Fle t l+ = + + -( ) - -( )[ ] + +1 0 1 2 3 2w w w p p w l e l2 1 2t t t t tX X X X= -( ) -( )[ ]- -ln ln ln ln ln ln ln lnX X X Xt t t t t-( ) = -( )- -1 2 2l ln ln ln lnX X X Xt t t t t+ + --( ) = -( )1 1 1 1l 592 G R Richards Copyright © 2004 John Wiley & Sons, Ltd J Forecast 23, 587–602 (2004) The same procedure can be used for the simple scale ratio, yielding the FSR model All the scale ratio models can be augmented with state transition terms, yielding the class of state transition scale ratio models (ST-SR, ST-RSR, ST-FSR, ST-FRSR) ESTIMATION OF THE FRACTAL PARAMETERS Estimation of the fractal parameters is based on scaling the log means of the absolute log- differences over increasing separation distances [see equations (6) and (7)] In effect, this exploits the relationship between the scaling symmetry and the function z(q) The mean (m) is the sample mean of the data The series of scaling exponents, q, can include negative as well as positive values, but here runs from 01 to 40, in increments of 01 The initial stage is to compute the scaling: (19a) (19b) (19c) where �t is a time series running from 1 to T The procedure is repeated for each value of q In the second stage, each series ln�tq corresponding with a value of q is regressed on the log of the time scale: (20) The coefficient w1 estimates z(q) for each value of q From equation (7), when q = 1, the expression [C1 / (a - 1)](qa - q) equals zero and z(q) = H Equivalently, H = z(1) When 1 < a < 2, the values of C1 and a are estimated using the first derivative of z(q) at the origin, denoted z¢(0) (Schertzer et al, 1997, p 445) This term is equal to z(1) plus a second term, which is a power-law function of a: (21) where k is a constant Multiplying both sides by q and subtracting z(q) from both yields: (22) which in turn implies the log-linear regression: (23) The coefficient w1 estimates a The antilog of the intercept is equal to [C1 / (a - 1)], so that the codimension can be estimated as C1 = [exp(w0)](a - 1) Because fractality is in evidence mainly at high frequencies, the primary data set used here con- sists of five intraday foreign exchange futures contracts These are proprietary series obtained from the Futures Communications Company, Inc, for futures contracts traded on American exchanges ln lnq q qt tz z w w e¢( ) - ( )[ ] = + +0 0 q q q Cz z k aa¢( ) - ( )[ ] = -( )[ ]0 11 z z k aa¢( ) = ( ) + -( )[ ]0 1 11C ln ln�t w w t eq t= + +0 1 1 ln ln ln ln�t m= -( )[ ] =-Y Y t Tt t T q at time ln ln ln ln�t m= -( )[ ] =-Y Y tt t q2 2at time ln ln ln ln�t m= -( )[ ] =-Y Y tt l q1 1at time A Fractal Forecasting Model 593 Copyright © 2004 John Wiley & Sons, Ltd J Forecast 23, 587–602 (2004) The measurement interval is one observation every 15 minutes Four sets of contracts are traded, with expirations at the end of each quarter The series tested are the September contracts for the Canadian dollar and German mark, the June contracts for the Swiss franc and the Japanese yen, and the December contract for the British pound The Canadian dollar contract runs from 1 July, 1976 to 31 December 1998, and provides 88,899 observations The other contracts start in December 1977, and run through the end of 1998 The number of observations is 79,984 for Germany, 79,799 for Switzerland and 85,846 for the United Kingdom Daily actual exchange rate series for the same five countries are also analyzed; these series were obtained from the US Federal Reserve The sample period is 24 August 1971, coinciding with the breakdown of the Bretton Woods fixed exchange rate system, through April 2001, except for the German mark, which runs until 31 December 1998 Figure 1 shows the log first-difference of the Canadian dollar The fractal structure is evident in the intermittent outlying values The other exchange rates show similar patterns Table I presents the estimated parameters, using an outer horizon of 200 days This rather short value for the outer horizon was determined empirically At long horizons, the codimension falls to zero, consistent with the idea that economic time series possess long-term equilibria For the exchange rate, the differential in real rates of return will be gradually equalized by arbitrage At extremely short horizons, however, the scaling function is often inestimable From equation (22), when [qz¢(0) - z(q)] < 0, equation (23) is indeterminate In essence, the scaling function yields mean- ingful values only for a particular range of time horizons 1971 1974 1977 1980 1983 1986 1989 1992 1995 1998 2001 -0020 -0015 -0010 -0005 0000 0005 0010 0015 0020 Figure 1 Log-difference, US–Canada exchange rate, 1971–2001 594 G R Richards Copyright © 2004 John Wiley & Sons, Ltd J Forecast 23, 587–602 (2004) The probability distribution has heavy tails: a ranges from 161 to 195 for the futures contract, and 179 to 188 for the actual exchange rate The degree of fractality is low: the codimension ranges from 0038 to 0085 for the futures contract, and 0031 to 0051 for the actual exchange rate The values of H range from 052 to 059, implying that the order of integration is fractional, but very close to unity: I(102) to I(109) Given the relationship postulated in equation (4), it is also germane to test interest rates The final lines show the results for two short-term interest rates in the United States, the Federal funds rate and 90-day Treasury bill rates, again at a daily frequency, estimated for 1971–2001 These series are also very close to the unit root case The probability distribution has lighter tails: a = 195 to 198 The degree of fractality is higher for the Federal funds rate: C1 = 0082, compared to C1 = 0059 for the Treasury bill rate This may reflect the way in which the Federal Reserve has targeted the overnight rate, engineering abrupt level shifts followed by periods of greater stability Table I Estimated parameters Time series H I(n) a C1 Canadian dollar Futures contract 052 102 (±0002) 161 (±002) 0042 (±004) Exchange rate 054 104 (±0002) 188 (±001) 0051 (±002) Fitted residual scale ratio 002 (±0002) 121 (±001) 0041 (±003) German mark Futures contract 058 108 (±0002) 189 (±0015) 0048 (±003) Exchange rate 058 108 (±0002) 187 (±003) 0041 (±007) Fitted residual scale ratio 006 (±0002) 118 (±0015) 0021 (±003) Japanese yen Futures contract 057 107 (±0002) 195 (±001) 0085 (±002) Exchange rate 057 107 (±0002) 186 (±002) 0031 (±005) Fitted residual scale ratio 008 (±0002) 137 (±002) 0050 (±004) Swiss franc Futures contract 059 109 (±0002) 183 (±003) 0051 (±006) Exchange rate 057 107 (±0002) 179 (±004) 0044 (±008) Fitted residual scale ratio 006 (±0002) 126 (±001) 0038 (±002) UK pound Futures contract 059 109 (±0002) 178 (±002) 0038 (±004) Exchange rate 057 107 (±0002) 181 (±002) 0040 (±005) Fitted residual scale ratio 007 (±0002) 121 (±001) 0027 (±002) Federal funds rate 052 102 (±003) 198 (±0008) 0082 (±0016) 90-day Treasury bill rate 053 103 (±004) 195 (±0007) 0059 (±0015) Note: H is estimated as z(1), rather than as the rescaled range coefficient I(n) is to the order of integration C1 is the fractal codimension of the mean, and a is the coefficient characterizing the probability distribution A Fractal Forecasting Model 595 Copyright © 2004 John Wiley & Sons, Ltd J Forecast 23, 587–602 (2004) FORECASTING EXPERIMENTS This section conducts a series of forecasting experiments, testing the scale ratio models against each other and the well-known GARCH (Bollerslev, 1986) and EGARCH (Nelson, 1991) models Both models are specified with a generalized probability distribution The main emphasis is on the exchange rate futures contract, denoted XCt Because of the high frequency of the futures data, a structural equation cannot be estimated, and the basic predictive model is simply a regression on one lag of the LHS: (24) The residual used in the RSR and ST-RSR models is the residual from this regression Two daily series were also tested, the Federal funds rate and the US Canada exchange rate Let t denote real output The basic forecasting equations for daily interest rates and the exchange rate are: (25) (26) The interest rates are the US Federal funds and the Canadian overnight rate Inflation is the CPI, and real output is the index of industrial production, interpolated to a daily frequency Each of these models was first estimated over the first 1000 data points, and forecasted iteratively one period ahead through the entire sample using the Kalman filter (Kalman, 1960) While the Kalman filter does not directly take account of the non-linear behaviour of the time-varying vari- ance, it does provide consistent estimators of the Gaussian quasi-likelihood The initial run of the model then serves as the baseline against which the other, more complex models are evaluated The forecast criterion is the root mean square error (RMSE) However, the key test of the fractal models is not so much the overall ability to forecast, but rather the ability to forecast outlying fluctuations (see on this issue Huisman et al, 2001) For this reason, the RMSE during the extreme state is also reported To facilitate comparisons, each of the forecast errors is also expressed as a ratio to the fore- cast error generated by the basic model Values below unity measure the percentage improvement in forecast accuracy Before running the forecasts, it is of interest to analyse the fractal properties of the scale ratio terms Table I reports the results for the fitted residual scale ratio, for each of the five futures con- tracts The estimates for C1 are similar to the actual futures contract series In most cases, however, the probability distribution has heavier tales Table II, Parts 1 through 5, gives the results of the experiments for the exchange rate futures con- tracts The results strongly favour the ST-FRSR model For the full sample, the reduction in the RMSE in this model is in the range of 1–7% in Canada, Germany, Japan and Switzerland, and a much more decisive 24% in the United Kingdom The most dramatic improvement in the forecast error occurs during the outlying events, where the ST-FRSR reduces the RMSE by 39% to 57% In two countries, Canada and the United Kingdom, the ST-EGARCH and ST-GARCH models yield approximately the same forecast errors for the outlying fluctuations as the ST-FRSR Table II, Parts 6 and 7, give the results for the daily Canadian dollar and the Federal funds rate In both cases, the ST-EGARCH, rather than one of the scale ratio models, achieves the smallest fore- cast error ln ln ln ln ln lnX X I It t t te Ft Fte t+ = + + -( ) - -( )[ ] +1 0 1 2w w w p p e ln ln ln ln lnI I Y Yt t t t t t+ -= + + -( ) + +1 0 1 2 1 3w w w w p e Y ln lnX XCt t t= + +-w w e0 1 1C 596 G R Richards Copyright © 2004 John Wiley & Sons, Ltd J Forecast 23, 587–602 (2004) Table II Model forecasting performance Model RMSE RMSE (outliers) Ratio Ratio (outliers) Part 1: Canada Exchange rate futures contract Basic model 314E-04 186E-04 SR 314E-04 186E-04 100 100 RSR 314E-04 186E-04 100 100 FSR 314E-04 186E-04 100 100 FRSR 314E-04 186E-04 100 100 GARCH 314E-04 186E-04 100 100 EGARCH 314E-04 186E-04 100 100 ST-Basic model 315E-04 186E-04 100 100 ST-SR 315E-04 186E-04 100 100 ST-RSR 315E-04 186E-04 100 100 ST-FSR 315E-04 186E-04 100 100 ST-FRSR 300E-04* 955E-05* 095* 051* ST-GARCH 312E-04 966E-05 099 052 ST-EGARCH 306E-04 955E-05* 097 051* Part 2: Germany Exchange rate futures contract Basic model 727E-04 420E-03 SR 727E-04 420E-03 100 100 RSR 728E-04 420E-03 100 100 FSR 727E-04 420E-03 100 100 FRSR 727E-04 420E-03 100 100 GARCH 727E-04 420E-03 100 100 EGARCH 728E-04 421E-03 100 100 ST-Basic model 728E-04 421E-03 100 100 ST-SR 728E-04 421E-03 100 100 ST-RSR 729E-04 421E-03 100 100 ST-FSR 728E-04 421E-03 100 100 ST-FRSR 682E-04* 245E-03* 093* 058* ST-GARCH 712E-04 254E-03 098 060 ST-EGARCH 705E-04 255E-03 097 060 Part 3: Japan Exchange rate futures contract Basic model 639E-04 451E-03 SR 639E-04 451E-03 100 100 RSR 639E-04 451E-03 100 100 FSR 639E-04 451E-03 100 100 FRSR 639E-04 451E-03 100 100 GARCH 639E-04 451E-03 100 100 EGARCH 640E-04 453E-03 100 100 ST-Basic model 639E-04 451E-03 100 100 ST-SR 640E-04 451E-03 100 100 ST-RSR 640E-04 451E-03 100 100 ST-FSR 639E-04 451E-03 100 100 ST-FRSR 634E-04* 275E-03* 099* 061* A Fractal Forecasting Model 597 Copyright © 2004 John Wiley & Sons, Ltd J Forecast 23, 587–602 (2004) Table II Continued Model RMSE RMSE (outliers) Ratio Ratio (outliers) ST-GARCH 658E-04 304E-03 103 067 ST-EGARCH 667E-04 432E-03 104 095 Part 4: Switzerland Exchange rate futures contract Basic model 835E-04 483E-03 SR 836E-04 483E-03 100 100 RSR 836E-04 483E-03 100 100 FSR 835E-04 484E-03 100 100 FRSR 835E-04 483E-03 100 100 GARCH 835E-04 483E-03 100 100 EGARCH 835E-04 483E-03 100 100 ST-Basic model 836E-04 484E-03 100 100 ST-SR 836E-04 484E-03 100 100 ST-RSR 837E-04 484E-03 100 100 ST-FSR 836E-04 485E-03 100 100 ST-FRSR 811E-04* 264E-03* 097* 054* ST-GARCH 835E-04 293E-03 099 060 ST-EGARCH 837E-04 380E-03 100 078 Part 5: United Kingdom Exchange rate futures contract Basic model 334E-06 286E-05 SR 334E-06 286E-05 099 100 RSR 334E-06 286E-05 100 100 FSR 334E-06 286E-05 100 100 FRSR 334E-06 286E-05 100 100 GARCH 334E-06 286E-05 099 100 EGARCH 334E-06 286E-05 100 100 ST-Basic model 334E-06 286E-05 099 100 ST-SR 334E-06 286E-05 099 100 ST-RSR 334E-06 286E-05 099 100 ST-FSR 334E-06 286E-05 099 100 ST-FRSR 256E-06* 123E-05* 076* 043* ST-GARCH 256E-06 123E-05* 077 043* ST-EGARCH 305E-06 198E-05 091 069 Part 6: US–Canada daily exchange rate Basic model 196E-03 706E-03 SR 196E-03 706E-03 100 099 RSR 196E-03 707E-03 100 100 FSR 196E-03 706E-03 100 100 FRSR 196E-03 706E-03 100 100 GARCH 196E-03 710E-03 100 100 EGARCH 196E-03 709E-03 100 100 ST-Basic model 196E-03 706E-03 100 100 ST-SR 196E-03 705E-03 100 099 ST-RSR 197E-03 706E-03 100 100 A Fractal Forecasting Model 599 Copyright © 2004 John Wiley & Sons, Ltd J Forecast 23, 587–602 (2004) In continuous time, the ARCH models converge to two-factor diffusions In the volatility diffu- sion literature, multiple-factor models have generally been found to be superior to the two-factor ARCH diffusions, because they reproduce other properties of financial market series, such as long memory (for a review, see Chernov et al, 2003) Including more stochastic factors additively, however, does not increase the number of multiplicative interactions, and should therefore not increase the degree of fractality Instead, the key mechanism is the multiplicative relationship between stochastic factors and Levy motions The issue now becomes identifying the type of Levy motion that can reproduce the degree of fractality observed in real-world series If the motion terms are specified as Brownian (the special case of Levy motion with a = 2), the fractal codimension is generally lower than actually observed in financial markets One hundred simulations of three-factor models with Brownian motion were run, and tested by multiple scaling The mean value of the estimated codimension is only 0027, well below the values reported in Table I With Brownian motion and a logarithmic specification for the stochastic factor in equation (1)— s[exp(w´10 + w´13U3t)](w¯11dW1t + w¯13dW3t)—the mean value of C1 rises to 0035 Exponentiation leads to explosive increases at irregular intervals A further possibility is to substitute generalized Levy motion, which encompasses heavier-tailed distributions Simulation of stochastic volatility models with generalized Levy motion have been found to be in close agreement with the properties of empirically observed series (Barndorff-Nielsen and Shephard, 2001, 2002) A more parsimonious approach is to retain Brownian motion as the fundamental unit, but model extreme events as Poisson jumping processes This uses two special cases of Levy motion rather than a generalized case (Duffie et al, 2000) To evaluate these hypotheses, further experiments were run Three-factor diffusions were simu- lated in discrete time using Brownian motion with Poisson jumps, and Student-t motion with varying degrees of freedom Due to space constraints, only a brief summary of the results is provided The Poisson jumping models yielded results very similar to the logarithmic models, with C1 averaging 0034 For large numbers of degrees of freedom, Student-t motion converges to Gaussian motion, and yields comparable results For 30 degrees of freedom, the codimension is estimated at 004 As the number of degrees of freedom diminish, the tails of the Student-t become heavier, and the codi- mension increases With 18 degrees of freedom, Student-t motion yields a mean value of the codi- mension in the area of 005 As the degrees of freedom decline, Student-t motion converges towards Cauchy motion At very low degrees of freedom—5 or below—the codimension rises to 009 With actual Cauchy motion, the value of C1 averages 012 Values of C1 in this range are never observed in economic time series By implication, the fundamental unit of motion in financial markets prob- ably has heavier tails than in the Gaussian distribution, but not as heavy as in the Cauchy Finally, multivariate diffusions that capture simultaneous equation relationships have also been found to replicate actual financial market behaviour (Johnson, 2002) Let Ytk be a vector of k time series, stk be a vector of k diffusion coefficients, and let Xk and Wk be matrices of structural coeffi- cients A simultaneous equation diffusion system can be written: (27) (28) (29) If the model structure is simultaneous rather than recursive, then the reduced forms of the equations will involve multiplicative relationships among the coefficients If the coefficients are time-varying dU dt dWtk k k tk3 3 3 3= +X W dU dt dWtk k k tk2 2 2 2= +X W dY U dt U dW dWtk k tk tk tk k tk tk= + +( )X W1 2 3 1 1 3s 598 G R Richards Copyright © 2004 John Wiley & Sons, Ltd J Forecast 23, 587–602 (2004) Table II Continued Model RMSE RMSE (outliers) Ratio Ratio (outliers) ST-FSR 196E-03 706E-03 100 100 ST-FRSR 196E-03 706E-03 100 100 ST-GARCH 184E-03 326E-03 093 046 ST-EGARCH 18198E-3* 29035E-3* 092* 041* Part 7: Daily Federal funds rate Basic model 917E-03 403E-02 SR 918E-03 403E-02 100 100 RSR 918E-03 403E-02 100 100 FSR 918E-03 403E-02 100 099 FRSR 918E-03 404E-02 100 100 GARCH 918E-03 396E-02 100 098 EGARCH 918E-03 403E-02 100 100 ST-Basic model 917E-03 403E-02 100 100 ST-SR 918E-03 401E-02 100 099 ST-RSR 918E-03 403E-02 100 100 ST-FSR 918E-03 403E-02 100 099 ST-FRSR 918E-03 404E-02 100 100 ST-GARCH 876E-03 278E-02 095 069 ST-EGARCH 866E-03* 253E-02* 094* 062* * Smallest RMSE Notes to Parts 1–5: The RMSE is the root mean squared error The ratio statistic is the ratio of the RMSE in the particular model to the RMSE of the basic model The basic model is a first-order autoregression, estimated by Kalman filter The state transition (ST) is defined as a rate of change more than 25 times the mean absolute rate of change The RSR is the resid- ual scale ratio model The FSR is the fitted scale ratio model The FRSR is the fitted residual scale ratio model Notes to Part 6: The basic model is equation (25) The state transition (ST) is defined as a rate of change more than 25 times the mean absolute rate of change Notes to Part 7: The basic model is equation (24) The state transition (ST) is defined as a rate of change more than 25 times the mean absolute rate of change In sum, the ST-FRSR model yields the best results for the highly volatile intraday data, while the ST-EGARCH performs better on the daily data Without the state transitions, however, there is little improvement in forecast accuracy Further, models based on constructing the scale ratio for the resid- ual dominate models using scale ratios of the overall process FRACTALITY, ARCH PROCESSES AND VOLATILITY DIFFUSIONS The favourable results for the ST-EGARCH on the daily series argue that in certain cases ARCH models can approximate fractal processes The fractal and ARCH literatures have sometimes been antagonistic, in part because multifractal models of asset returns have incorrectly used a multi- plicative cascade paradigm While the cascade mechanism is known in models of physical turbu- lence, it has no analogue in economics Once it is recognized that fractality can also be generated by other types of multiplicative models, however, a key parallel between these approaches emerges Specifically, both conditional heteroskedasticity and localized scaling symmetries can be generated by volatility diffusions 600 G R Richards Copyright © 2004 John Wiley & Sons, Ltd J Forecast 23, 587–602 (2004) at high frequencies, this introduces an additional multiplicative factor A final set of simulation experiments were run to evaluate simultaneous equation systems With some stochastic variation in the coefficients, the fractal codimension was found to lie in a range of 005 to 011 The lower values of these estimates are more consistent with the observed values, implying only minor co- efficient variation CONCLUSIONS Volatility diffusions with various types of Levy motion—Brownian motion with Poisson jumps, Student-t motion, as well as simultaneous equation systems—are all capable of reproducing the frac- tality observed in the real world If the fundamental data-generating process can be represented by a stochastic volatility diffusion, then it is possible to forecast either using models of the diffusion coefficient, as in the ARCH class, or models of the localized scaling symmetry, as in the SR class Neither approach necessarily dominates the other, but both classes can be enhanced by including state transitions Of the fractal paradigms tested here, the optimal model for the intraday exchange rate futures contract is the ST-FRSR, which reduces the predictive error primarily by capturing extreme fluctuations more accurately The forecast error during the outlying events is reduced by between two-fifths and three-fifths, a highly significant outcome REFERENCES Andersen TG 1994 Stochastic autoregressive volatility: a framework for volatility modeling Mathematical Finance 4: 75–102 Andersen TG, Bollerslev T 1997 Heterogeneous information arrivals and return volatility dynamics: uncovering the long-run in high frequency returns Journal of Finance 52: 975–1005 Andersen TG, Lund J 1997 Estimating continuous-time stochastic volatility models of the short-term interest rate Journal of Econometrics 77: 343–377 Andersen TG, Chung HJ, Sorensen BE 1999 Efficient methods of moments estimation of a stochastic volatility model: a Monte Carlo study Journal of Econometrics 91: 61–87 Barndorff-Nielsen OE, Shephard N 2001 Non-Gaussian Ornstein–Uhlenbeck based models and some of their uses in financial economics Journal of the Royal Statistical Society, Series B 63(2): 167–241 Barndorff-Nielsen OE, Shephard N 2002 Econometric analysis of realized volatility and its use in estimating stochastic volatility models Journal of the Royal Statistical Society, Series B 64(2): 253–280 Bates DS 1996 Jumps and stochastic volatility: exchange rate processes implicit in DM options Review of Finan- cial Studies 9: 69–107 Beran J 1992 Statistical methods for data with long-range dependence Statistical Science 7: 404–427 Bollerslev T 1986 Generalized autoregressive conditional heteroskedasticity Journal of Econometrics 31: 307–327 Bollerslev T, Mikkelsen HO 1996 Modeling and pricing long memory in stock market volatility Journal of Econometrics 73: 151–184 Brock W, Sayers C 1988 Is the business cycle characterized by deterministic chaos? Journal of Monetary Economics 22: 71–90 Calvet L, Fisher A 2002 Multifractality in asset returns: theory and evidence Review of Economics and Statistics 84: 381–406 Chernov M, Gallant AR, Ghysels E, Tauchen G 2003 Alternative models for stock price dynamics Journal of Econometrics 116: 225–257 A Fractal Forecasting Model 601 Copyright © 2004 John Wiley & Sons, Ltd J Forecast 23, 587–602 (2004) Duffie D, Pan J, Singleton K 2000 Transform analysis and option pricing for affine jump-diffusions Economet- rica 68: 1343–1377 Fouque JP, Papanicolaou G, Sircar KR 2000 Mean-reverting stochastic volatility Journal of Theoretical and Applied Finance 3: 101–142 Gallant AR, Hsu CT, Tauchen G 1999 Using daily range data to calibrate volatility diffusions and extract the forward integrated variance Review of Economics and Statistics 81: 617–631 Gray SF 1996 Modeling the conditional distribution of interest rates as a regime-switching process Journal of Financial Economics 42: 27–62 Hamilton JD 1989 A new approach to the economic analysis of nonstationary time series subject to changes in regime Econometrica 57: 357–384 Hamilton JD 1994 Specification testing in Markov-switching time series models Journal of Econometrics 70: 127–157 Hsieh D 1991 Chaos and nonlinear dynamics: application to financial markets Journal of Finance 46: 1839–1877 Hsieh D 1993 Implications of nonlinear dynamics for financial risk management Journal of Financial and Quantitative Analysis 28: 41–64 Huisman R, Koedijk KG, Kool CML, Palm F 2001 Tail index estimates in small samples Journal of Business and Economic Statistics 19: 208–216 Hurst HE 1951 The long-term storage capacity of reservoirs Transactions of the American Society of Civil Engineers 116: 770–808 Johnson TC 2002 Volatility, momentum and time-varying skewness in foreign exchange returns Journal of Business and Economic Statistics 20: 390–411 Kalman RE 1960 A new approach to linear filtering and prediction problems Transactions of the American Society of Mechanical Engineers, Journal of Basic Engineering 83D: 35–45 Lavallee D, Schertzer D, Lovejoy S 1991 On the determination of the codimension function In Nonlinear Variability and Geophysics: Scaling and Fractals, Schertzer D, Lovejoy S (eds) Kluwer: Dordrecht; 99– 110 Lavallee D, Lovejoy S, Schertzer D, Schmitt F 1992 On the determination of universal multifractal parameters in turbulence In Dynamics of Fluids and Plasmas, Moffatt HK et al (eds) Kluwer: Amsterdam; 463–478 Mandelbrot B 1997 Fractals and Scaling in Finance Springer: New York Mantegna RN, Stanley HE 1995 Scaling behavior in the dynamics of an economic index Nature 376: 46–49 Mantegna RN, Stanley HE 1996 Turbulence and financial markets Nature 383: 587–588 Mantegna RN, Stanley HE 1997 Stock market dynamics and turbulence: parallel analysis of fluctuations phenomena Physica A 239: 255–266 Mantegna RN, Stanley HE 1998 Physics investigation of financial markets In Proceedings of the International School of Physics, Mallamace F, Stanley F (eds) IOS Press: Amsterdam; 473–489 Mantegna RN, Stanley HE 1999 An Introduction to Econophysics: Correlations and Complexity in Finance Cambridge University Press: Cambridge Medio A 1992 Chaotic Dynamics Theory and Applications to Economics Cambridge University Press: Cambridge Nelson DB 1991 Conditional heteroskedasticity in asset returns: a new approach Econometrica 52: 347–370 Richards GR 2002 Fractality in a macroeconomic model: nonlinear oscillation around an underlying equilibrium Fractals 10: 235–251 Schertzer D, Lovejoy S 1991 Scaling and nonlinear variability in geodynamics: multiple singularities observ- ables and universality classes In Nonlinear Variability and Geophysics: Scaling and Fractals, Schertzer D, Lovejoy S (eds) Kluwer: Dordrecht; 41–82 Schertzer D, Lovejoy S, Schmitt F, Chigirinskaya Y, Marsan D 1997 Multifractal cascade dynamics and turbu- lent intermittency Fractals 5: 427–471 Schmitt F, Lavallee D, Schertzer D, Lovejoy S 1992 Empirical determination of universal multifractal exponents in turbulent velocity fields Physical Review Letters 68: 305–308 Schmitt F, Schertzer D, Lovejoy S, Brunet Y 1993 Estimation of universal multifractal indices for atmospheric turbulent velocity fields Fractals 1: 568–575 Schmitt F, Schertzer D, Lovejoy S 1999 Multifractal analysis of foreign exchange data Applied Stochastic Models and Data Analysis 15: 29–53 Terasvirta T 1994 Specification estimation and evaluation of smooth-transition autoregressive models Journal of the American Statistical Association 89: 208–218 602 G R Richards Copyright © 2004 John Wiley & Sons, Ltd J Forecast 23, 587–602 (2004) Author’s biography: Gordon R Richards is a statistician with Sprint Telecommunications He has also worked with Intel His research interests include econometric models as well as time series analysis Author’s address: Gordon R Richards, Sprint Telecommunications, 6180 Sprint Parkway, Overland Park, KS 66251, USA
Recommended